
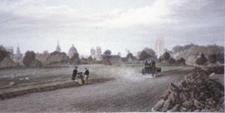
The Henley coach approaching
the turnpike road from
In the 18th and 19th
centuries, individual turnpike trusts in
The influence of London-bound traffic is
evident in the dates at which turnpikes were created. Counties such as
Berkshire, Hertfordshire and Buckinghamshire had several turnpikes covering the
radial roads from
The different pattern of turnpike
development may reflect the way tolls fell on the various communities. Around
Differences in the topology, access to competing
water-borne transport, sources of wealth in the area and proximity to the homes
and resorts of the rich made for significant differences in the pattern of
turnpike development in particular counties. The rapid rise in manufacture in
the towns of
The steep decline in long-distance road travel due to the arrival of railways followed a similar pattern to the original diffusion of road turnpiking, but at a much faster pace. The pressures that finally led to the closure of turnpike trusts were national, expressed through Acts of Parliament that brought large clutches of trusts to an end with no regard to county. Hence, in most counties the years in which turnpike closure occurred was similar, a prelude to the eventual creation of County Councils and a true county based organisation of roads.
Summaries of the turnpike system in individual counties can be found by clicking on the links below.
- Berkshire
(pre-1974 county) go directly map of trusts or to tables of tollhouses
- Buckinghamshire
- Cornwall
go directly map of trusts or to tables of tollhouses
- Devon go directly map of trusts or to tables of tollhouses
- Dorset go directly map of trusts or to tables of tollhouses
- Oxfordshire (pre1974 county)
- Somerset
go directly map of trusts or to tables of tollhouses
Turnpike
mileage and milestone numbers by English County
|
COUNTY |
Estimated Turnpike
Mileage |
Area (1000 acres) |
turnpike miles per 100
acre |
Guess at Total surviving
milestones# |
% of originals surviving |
Total Milestones Listed
by EH |
|
BEDFORDSHIRE |
220 |
305 |
0.6 |
18 |
8% |
1 |
|
|
210 |
|
|
102 |
49% |
86 |
|
BUCKINGHAMSHIRE |
210 |
477 |
3.1 |
147 |
70% |
16 |
|
CAMBRIDGESHIRE |
200 |
|
|
138 |
69% |
104 |
|
|
520 |
649 |
4.5 |
295 |
57% |
70 |
|
|
380 |
881 |
5.7 |
500 |
132% |
340 |
|
|
590 |
|
|
260 |
44% |
188 |
|
DERBYSHIRE |
600 |
635 |
3.0 |
188 |
31% |
116 |
|
|
830 |
1657 |
2.4 |
400 |
48% |
131 |
|
|
480 |
623 |
3.7 |
228 |
48% |
53 |
|
|
520 |
649 |
2.4 |
155 |
30% |
75 |
|
|
|
|
|
112 |
|
17 |
|
|
280 |
907 |
1.3 |
119 |
43% |
52 |
|
GLOUCESTERSHIRE |
1060 |
804 |
2.7 |
220 |
21% |
148 |
|
HAMPSHIRE |
670 |
962 |
3.5 |
335 |
50% |
106 |
|
HEREFORDSHIRE |
510 |
539 |
4.6 |
250 |
49% |
107 |
|
HERTFORDSHIRE |
260 |
403 |
2.2 |
90 |
35% |
62 |
|
|
647 |
921 |
1.8 |
165 |
26% |
25 |
|
|
740 |
|
|
110 |
15% |
77 |
|
LEICESTERSHIRE |
|
534 |
1.3 |
72 |
|
50 |
|
|
465 |
1704 |
0.8 |
140 |
30% |
81 |
|
MIDDLESEX |
170 |
|
|
65 |
|
0 |
|
|
350 |
1314 |
2.7 |
350 |
100% |
18 |
|
|
|
|
|
400 |
|
247 |
|
NORTHAMPTONSHIRE |
450 |
585 |
0.5 |
30 |
7% |
11 |
|
NORTHUMBERLAND |
400 |
1291 |
1.6 |
210 |
53% |
162 |
|
NOTTINGHAMSHIRE |
340 |
539 |
0.6 |
35 |
10% |
10 |
|
OXFORDSHIRE
* |
330 |
|
|
190 |
58% |
71 |
|
|
70 |
97 |
1.0 |
10 |
14% |
6 |
|
|
750 |
862 |
3.5 |
300 |
40% |
159 |
|
|
930 |
1032 |
2.8 |
285 |
31% |
214 |
|
|
|
|
|
144 |
|
111 |
|
STAFFORDSHIRE |
760 |
740 |
5.2 |
387 |
51% |
188 |
|
|
280 |
948 |
1.6 |
150 |
54% |
15 |
|
|
290 |
415 |
4.0 |
165 |
57% |
20 |
|
|
700 |
932 |
0.7 |
65 |
9% |
0 |
|
WARWICKSHIRE |
460 |
624 |
0.7 |
45 |
10% |
14 |
|
|
|
3897 |
2.6 |
340 |
|
233 |
|
WILTSHIRE |
630 |
860 |
4.4 |
380 |
60% |
302 |
|
WORCESTERSHIRE |
660 |
449 |
5.1 |
230 |
35% |
29 |
|
|
|
|
|
7825 |
|
3821 |
|
*
Old Counties of Oxon and Berks differ significantly from current |
|
All |
|
# based on MSS surveys |
|
|
This page created by Alan Rosevear 16th Oct 2008.
Last Edited 5th Feb 2009